
New data shows traffic down around Homerton LTN
New traffic monitoring from the Homerton low traffic neighbourhood shows traffic down both inside the LTN and on boundary roads.
The data, taken in May 2021 at 24 locations in and around the low traffic neighbourhood, shows traffic down on average inside the LTN by 35%, and down on boundary roads by 5% compared to before the pandemic.
At the same time as these reductions, background traffic levels according to counts taken on 12 of the borough’s main roads, were shown to be on average 1% higher than in the same period in 2019*.
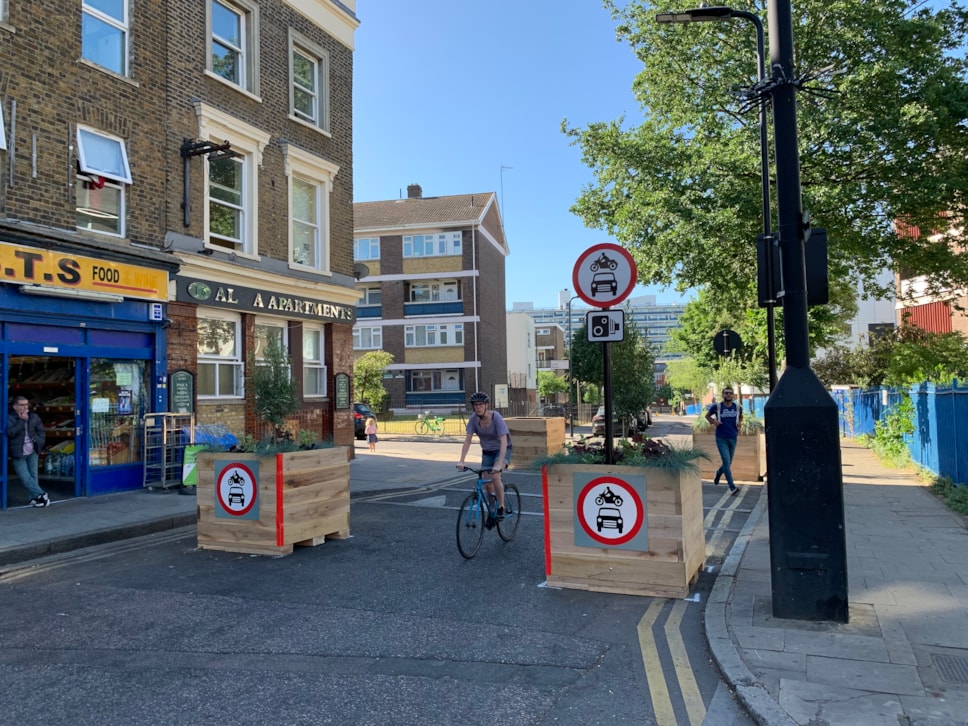
Following the introduction of the Barnabas Road traffic filter on 4 June 2020, which was joined by filters on Ashenden Road and Meeson Street in Homerton on 11 June 2020, to complete the Homerton low traffic neighbourhood.
The Council has been monitoring traffic levels in the area, and has also carried out air quality monitoring at nine sites in the area, which it will share in the coming weeks.
Monitoring from November 2020 showed traffic down by 40% inside the LTN and 7% on boundary roads.
The Council will be releasing updated traffic and air quality monitoring for all of its new low traffic neighbourhoods in the coming months.
Find out more about the Homerton LTN: https://rebuildingagreenerhackney.commonplace.is/proposals/homerton
Notes
*Council analysis of TfL traffic counts at 12 sites in Hackney shows that overall traffic in the borough between 22 and 28 May 2021 was 1% higher than over the same period in 2019.
The tables below show changes in traffic on roads in and around the Homerton low traffic neighbourhood from a pre-pandemic baseline to November 2020 and May 2021. They show daily average flows over a seven day period on roads in and around the Homerton LTN before the introduction of the LTN, and how that flow has changed since the introduction of the LTN when monitoring counts were taken in November 2020 and May 2021
Traffic Change on Roads within Homerton LTN compared to pre-COVID Baseline | ||||||
Road | Baseline Date | Baseline traffic | November 2020 traffic | Change from Baseline (%) | May 2021 traffic | Change from Baseline (%) |
Glyn Road | Mar 2019 | 603 | 701 | 16 | 748 | +24 |
Daubeney Road (south of Ashenden Rd) | Dec 2018 | 1066 | 517 | -52 | 565 | -47 |
Daubeney Road (North of Ashenden Rd) | Mar 2019 | 1000 | 689 | -31 | 740 | -26 |
Meeson Street | Mar 2019 | 757 | 95 | -87 | 109 | -86 |
Meeson Street | Mar 2019 | 624 | 100 | -84 | 145 | -77 |
Kingsmead Way | Feb 2019 | 1130 | 1035 | -8 | 943 | -17 |
Kingsmead Way | Feb 2019 | 1031 | 1027 | 0 | 1531 | +48 |
Durington Road | Mar 2019 | 244 | 165 | -32 | 161 | -34 |
Ashenden Road | Mar 2019 | 1259 | 334 | -73 | 344 | -73 |
Roding Road (North of Ashenden Rd) | Mar 2019 | 363 | 327 | -10 | 341 | -6 |
Roding Road (South of Ashenden Rd) | Mar 2019 | 735 | 928 | 26 | 1013 | +38 |
Coopersale Road | Mar 2019 | 1058 | 460 | -57 | 768 | -27 |
Ballance Road | Dec 2019 | 1230 | 467 | -62 | 460 | -63 |
Hassett Road | Dec 2019 | 1436 | 1089 | -24 | 927 | -35 |
Barnabas Road (North of Daley Road) | May 2018 | 1518 | 754 | -50 | 1126 | -26 |
Barnabas Road (south of Berger Rd) | Dec 2019 | 3275 | 1296 | -60 | 1091 | -67 |
Barnabas Road (South of Hassett Rd) | Dec 2019 | 2477 | 999 | -60 | 1359 | -45 |
Berger Road | Dec 2019 | 1607 | 564 | -65 | 528 | -67 |
Oriel Road | Dec 2019 | 1422 | 301 | -79 | 285 | -80 |
Average % Change | - 42 | Average % Change | -35 |
Traffic Change on Boundary Roads of Homerton LTN compared to pre-Covid Baseline | ||||||
Road | Baseline Date | Baseline traffic | November 2020 traffic | Change from Baseline (%) | May 2021 traffic | Change from Baseline (%) |
Homerton Road (jw Lee Conservancy Road) | Mar 2019 | 12147 | 10293 | -15 | 13503 | +11 |
Homerton High Street jw Barnabas Road | May 2019 | 21833 | 20494 | -6 | 20848 | -5 |
Wick Road east of jw Barnabas Road | Dec 2019 | 14194 | 12532 | -12 | 13275 | -6 |
Wick Road West of jw Barnabas Road | Dec 2019 | 14619 | 13091 | -10 | 13748 | -6 |
Kenworthy Road (south of jw Ballance Road) | Nov 2019 | 16854 | 14493 | -14 | 13275 | -21 |
Average % Change | -12 | Average % Change | -5 |
We’re thoroughly assessing the impact of our low traffic neighbourhoods on traffic and air quality, with all the signs in Homerton showing that there are positive effects inside the LTN and on boundary roads, helping people to walk, shop and cycle locally, and creating quieter, cleaner streets for people to enjoy.
We’ll be considering this data, alongside air quality data, responses from consultations on LTNs and borough-wide polling before making decisions on whether or not to make them permanent.
As we come out of COP26, we are more committed than ever to doing all we can to reach net zero by 2040 and rebuild a greener Hackney - through our tree planting, switching our electricity to 100% renewable and by tackling transport emissions, which account for a quarter of the borough’s carbon footprint.Cllr Mete Coban MBE, Cabinet Member for Energy, Waste, Transport and Public Realm