
‘Transformative’ Hoxton West LTN retained
Hoxton West low traffic neighbourhood (LTN) is being retained by Hackney Council after analysis showed significant reductions in traffic levels and air pollution in and around the area.
The Council’s decision also took into account comments received from residents, changes in bus speeds and a comprehensive equalities impact assessment, looking at the impact of the low traffic neighbourhood on groups with protected characteristics, such as race, gender or disability.
The scheme is part of Hackney Council plans to rebuild a greener Hackney in the aftermath of the pandemic - with 19 trial low traffic neighbourhoods and 40 School Streets introduced to support people to walk, shop and cycle locally and create cleaner, greener neighbourhoods.
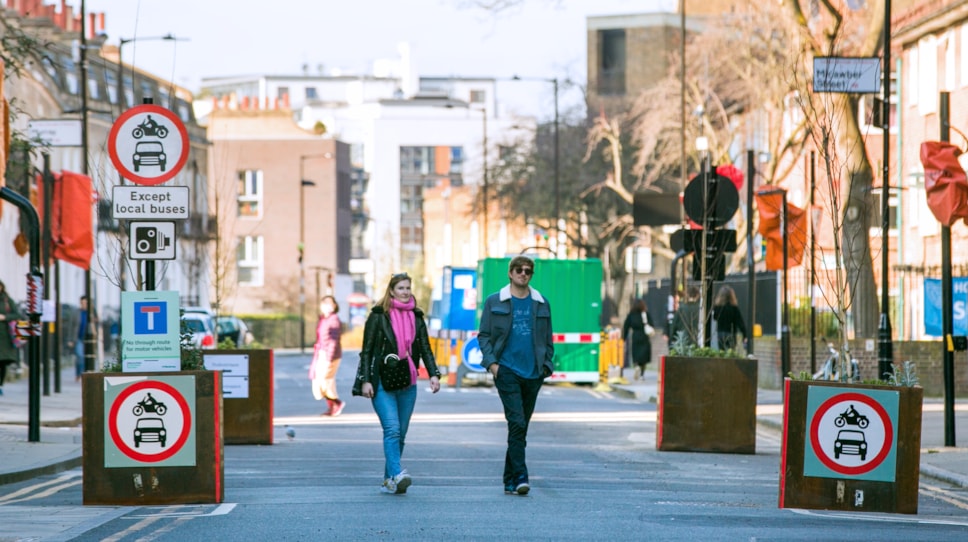
In Hoxton West, four traffic filters - planters in the road which permit only cyclists, emergency and waste vehicles to pass through - were installed on a trial basis in 2020 in Shepherdess Walk, Micawber Street, Ebenezer Street and Nile Street.
Analysis of traffic, air quality and bus speeds data following the LTN’s introduction shows that:
- Traffic was down by 46% inside the LTN and by 18% on boundary roads
- Air quality is predicted to have improved at 58 of 62 modelled locations in the area, with increases in pollution of less than one per cent at four of the 62 locations
- Average bus speeds in the area have improved: from 9.6mph in 2019 to 11.2mph in 2021.
Following comments from residents, some changes are being made to the low traffic neighbourhood:
- To improve access for disabled residents, Blue Badge holders will be able to drive through the Shepherdess Walk traffic filter from 21 February, once they have registered for an exemption
- The Council is in discussion with Islington Council about providing exemptions from the St Peter’s Low Traffic Neighbourhood for Hoxton West Blue Badge holders.
Throughout the trial, the Council encouraged people to respond to its Commonplace page, which was used to identify issues with the LTN and make changes where appropriate. 1697 responses were received.
37% of responses were from the local area, with people who use a car or van to get around overrepresented in the overall results (64% of responses were from motor vehicle users, compared to the 30% of households in the borough that own a vehicle).
Overall, 31% of Commonplace responses wanted all or some of the filters to be made permanent, with 67% saying none should be made permanent.
In the local area (those who gave an N1 postcode), 31% of responses wanted all or some of the filters to be made permanent, with 67% saying none should be made permanent.
Among people who do not use a car or van to get around, 59% wanted all or some of the LTN to be made permanent.
The top two concerns raised in resident responses were increased traffic and air pollution, which is why the Council has completed comprehensive monitoring of the scheme before making a decision on whether or not to make it permanent.
For more information, visit: hackney.gov.uk/hoxton-west-ltn
ENDS
Notes to editors
Full traffic and air quality analysis
The tables below compare traffic counts taken in July 2021 and November 2020 with the last available comparable count before the pandemic. Each traffic count is a daily average.
Some counts are listed as not available either because there is no comparable pre-implementation count or because they were out of action or vandalised when monitoring took place.
Changes in traffic levels on boundary roads
Air quality
The Council commissioned an external consultancy, AECOM, to undertake the air quality modelling to determine any potential impacts, both positive and negative, that the implementation of the Hoxton West LTN may have had on air pollutant levels both within the scheme area and on the boundary roads. The air quality modelling considered changes to the annual mean concentrations of the air pollutants (NO2) and particulate matter, as both PM10 and PM2.5. The dispersion modelling uses complex computer software to estimate the levels both with the scheme in place and without, in order to allow comparisons to be made.
The Hoxton West low traffic neighbourhood is predicted to have decreased nitrogen dioxide concentrations at 58 of the 62 modelled locations, with four locations showing an increase. These four locations were along East Road, with small increases in nitrogen dioxide concentrations of less than 1%. There was no significant impact on particulate matter concentrations.
Anyone who visits the Hoxton West low traffic neighbourhood knows that its effect has been truly transformative. I went down earlier this week and was incredibly proud to see people of all ages walking and cycling through the area, with quieter, safer streets and much improved air quality.
We know that some people had concerns about traffic and air quality as a result of the LTN, which is why we’ve been looking at the extremely positive traffic, air quality and bus speed data before making a decision.
As with all parts of our plans to rebuild a greener Hackney, we’ll be continuing to monitor schemes and listen to feedback.
Cllr Mete Coban MBE, Cabinet Member for Energy, Waste, Transport and Public Realm