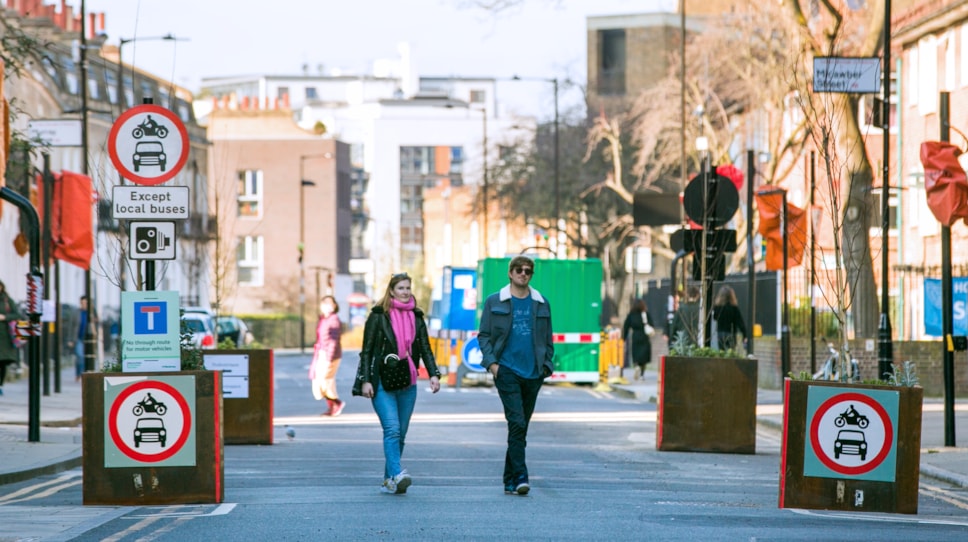
Traffic down in and around Hoxton West LTN
Traffic is down both inside and around the Hoxton West Low Traffic Neighbourhood (LTN) following its introduction, new monitoring data shows.
The monitoring data, taken in July 2021, shows that traffic was down inside the LTN by 46%, and on boundary roads by nearly a fifth (18%).
At the same time as the traffic reductions inside the Hoxton West LTN, background traffic levels across the borough were shown to be on average 2.6% lower than in the same period in 2019*.
The Hoxton West LTN was introduced in 2020 alongside 18 other low traffic neighbourhoods and 40 School Streets, under Council plans to rebuild a greener Hackney after the pandemic and is supporting people to walk, shop and cycle locally.
Monitoring data was taken from 11 roads inside the low traffic neighbourhood and three boundary roads.
*Council analysis of TfL traffic counts at 12 main roads in Hackney shows that overall traffic in the borough was 2.6% lower than over the same period in 2019.
The tables below show changes in traffic on roads in and around the Hoxton West low traffic neighbourhood from a pre-pandemic baseline to November 2020 and July 2021. They show daily average flows over a seven day period on roads in and around the Hoxton West LTN before the introduction of the LTN, and how that flow has changed since the introduction of the LTN when monitoring counts were taken in November 2020 and July 2021
Table 1: Traffic Change on Roads within Hoxton LTN compared to pre-COVID Baseline | ||||||
Road | Baseline Date | Baseline | November 2020 | Change from Baseline (%) | July 2021 | Change from Baseline (%) |
Shepherdess Walk (North of Murray Grove) | Jul 2018 | 3065 | 1725 | -43.7% | 2194 | -28.4% |
Micawber Street (West of Taplow Street) | Jul 2018 | 3521 | 928 | -73.6% | 1064 | -69.8% |
Wharf Road (South of Micawber Street) | Not Available | Not Available | 1778 | Not Available | 2548 | Not Available |
Thoresby Street (South of Micawber Street) | Not Available | Not Available | 69 | Not Available | 1020 | Not Available |
Windsor Terrace (South of Micawber Street) | Not Available | Not Available | 1026 | Not Available | 927 | Not Available |
Wellesley Terrace (South of Micawber Street) | Not Available | Not Available | 1020 | Not Available | 91 | Not Available |
Shepherdess Walk (South of Nile Street) | Jul 2018 | 5809 | 2619 | -54.9% | 2194 | -62.2% |
Westland Place (South of Nile Street) | Jul 2018 | 802 | 484 | -39.7% | 481 | -40.0% |
Nile Street (East of Shepherdess Walk) | Jul 2018 | 2466 | 721 | -70.8% | 480 | -80.5% |
Britannia Walk (South of Nile Street) | Jul 2018 | 778 | 813 | 4.5% | 761 | -2.2% |
Murray Grove (East of Provost Street) | Jul 2018 | 6406 | 3187 | -50.2% | 1402 | -78.1% |
Provost Street (South of Murray Grove) | Jul 2018 | 973 | 1039 | 6.8% | 319 | -67.2% |
Provost Street (South of Nile Street) | Not Available | Not Available | 512 | Not Available | 986 | Not Available |
Vestry Street (North of Provost Street) | Jul 2018 | 9556 | 4477 | -53.1% | 7120 | -25.5% |
Pitfield Street (South of Charles Square) | Not Available | Not Available | 3792 | Not Available | 4637 | Not Available |
Haberdasher Street (West of Pitfield Street) | Jul 2018 | 1220 | 1393 | 14.2% | 1190 | -2.5% |
Pitfield Street (North of Charles Square) | Jul 2018 | 5437 | 4391 | -19.2% | Not Available | Not Available |
Coronet Street (North of Old Street) | Not Available | Not Available | 1450 | Not Available | 1238 | Not Available |
Average % Change | -35.0% | Average % Change | -46.0% |
Table 2: Traffic Change on Boundary Roads of Hoxton West LTN compared to pre-Covid Baseline | ||||||
Road | Baseline Date | Baseline | March 2021 | Change from Baseline (%) | July 2021 | Change from Baseline (%) |
City Road (West of Wharf Road) | Not Available | Not Available | 24191 | Not Available | 24034 | Not Available |
City Road (East of Cayton Street) | 2018 | 33086 | 24238 | -26.7% | 24952 | -24.6% |
East Road (North of Brunswick Place) | Not Available | Not Available | 5176 | Not Available | 8046 | Not Available |
East Road (North of Bevenden Street) | 2018 | 14557 | 8971 | -38.4% | 12701 | -12.7% |
New North Road (North of Murray Grove) | Nov 2018 | 18395 | 11454 | -37.7% | 15089 | -18.0% |
Old Street (East of Roundabout) | 2018 | 39307 | 32797 | -16.6% | Not Available | Not Available |
Old Street (East of Great Eastern Street) | Not Available | Not Available | 14925 | Not Available | 15358 | Not Available |
City Road (East of Mora Street) | Not Available | Not Available | 25445 | Not Available | 25173 | Not Available |
Average % Change | -30.0% | Average % Change | -18.0% |
These traffic reductions in and around Hoxton West low traffic neighbourhood are significant because they far exceed the 2.6% reductions in background traffic in Hackney in July 2021, showing how LTNs can reduce traffic both inside neighbourhoods and across a wider area, rebuilding a cleaner, greener Hackney for all of our residents.
We’ve also looked at air quality data in and around the LTN, which we’ll share early in the new year.Cllr Mete Coban MBE, Cabinet Member for Energy, Waste, Transport and Public Realm
