
Keep informed about air quality in Hackney with new pollution map
A new online air quality map has been launched by Hackney Council as part of its plans to rebuild a greener borough in the aftermath of the pandemic.
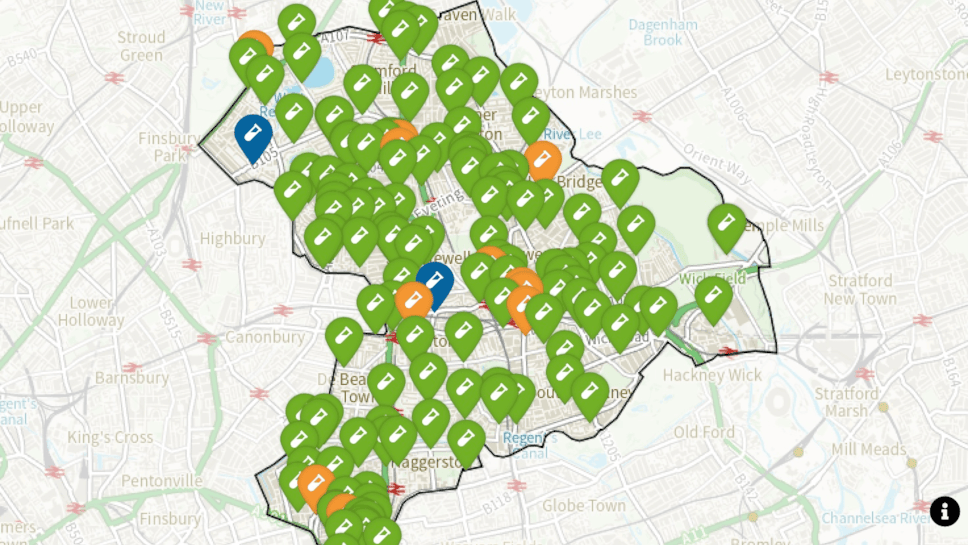
The map shows levels of nitrogen dioxide pollution at 140 sites across the borough, helping residents to stay informed about pollution levels near them.
It uses data from a network of fixed diffusion tube monitors - which take an average of nitrogen dioxide pollution over the calendar year.
Nitrogen dioxide is associated with a number of heart and lung conditions including asthma. Locations with nitrogen dioxide pollution levels that meet short and long-term air quality objectives are shown in green. Orange shows locations that fail to meet the long-term objective but are expected to meet the short-term objective.
Data from the borough’s extensive monitoring network shows that there was a reduction in air pollutant concentrations at almost all locations in 2020, with NO2 readings below air quality objectives at almost all sites in the borough.
Four new automatic air quality monitoring stations, which show levels of pollution in real time, are soon also set to be displayed through the Council’s air quality web pages. These are in addition to the existing monitoring station located in Old Street and will be in place for the next two years. The automatic monitors will help to monitor trends in NO2 and particulate matter pollution in real-time, so the Council can check that reductions in NO2 concentrations in 2020 are being replicated.
In addition to nitrogen dioxide pollution, the four live air quality monitors will also measure particulate matter pollution - tiny particles emitted predominantly by motor vehicles and by burning wood and coal - which are known to exacerbate respiratory health conditions such as asthma and increase the likelihood of cardiovascular problems.
To view the map and find out more, visit hackney.gov.uk/air-quality.
*For the short-term annual objective for nitrogen dioxide to be met, concentrations must not exceed 200 μg m3 more than 18 times a year. For the long-term annual objective for nitrogen dioxide to be met, the annual mean concentration at a location must not be more than 40 μg m3.
London’s air quality is improving, thanks to the Ultra Low Emissions Zone, emissions-based parking permits in Hackney and our long-term work to reduce car ownership in the borough, but it remains a public health crisis, killing 10,000 people every year in the capital.
This new air quality map will help keep residents informed about air quality in the borough, and helps us to target our resources at the right places.
We also mustn’t ignore the bigger picture: London’s toxic air is caused predominantly by road traffic - which was higher in 2019 than it was ten years before - and wood and coal burning. That’s why it’s imperative that we continue to encourage people to walk, cycle and take public transport over driving and rebuild a greener Hackney for all our residents.
Cllr Mete Coban MBE, Cabinet Member for Energy, Waste, Transport and Public Realm