
Hackney Downs low traffic neighbourhood retained - with changes
Hackney Downs low traffic neighbourhood (LTN) is being retained, with some important changes, following analysis of comments from residents, traffic, air quality and bus speeds data.
The low traffic neighbourhood was introduced in September 2020, and is part of plans to rebuild a greener Hackney after the pandemic - with 19 trial low traffic neighbourhoods and 40 School Streets introduced to support people to walk, shop and cycle locally and create cleaner, greener neighbourhoods.
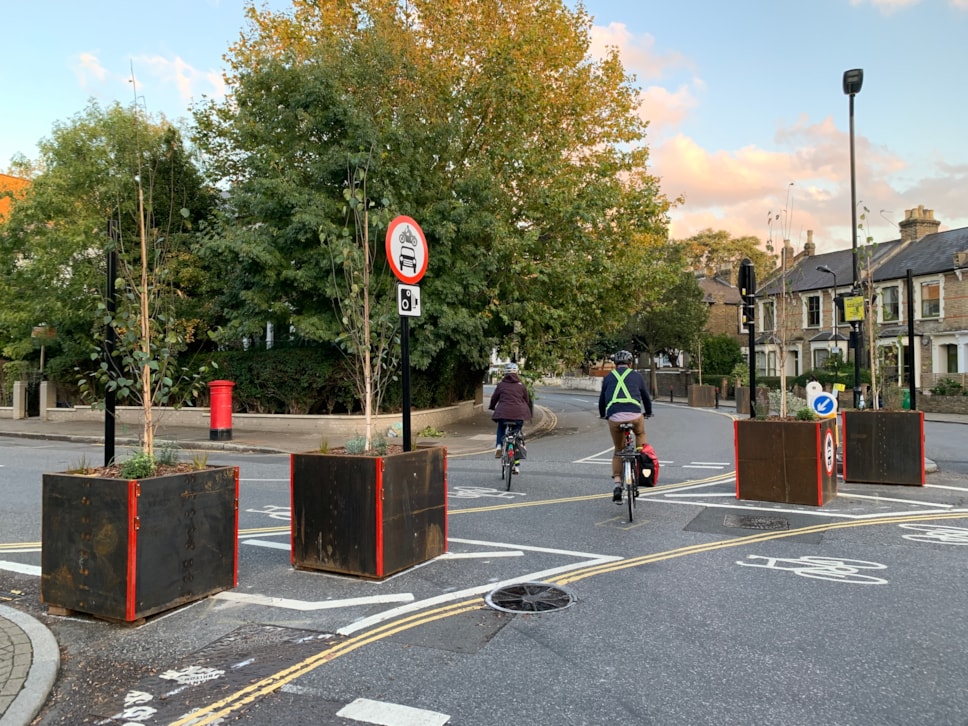
It features six traffic filters (planters in the road that allow only cyclists, waste and emergency vehicles to pass through) in the area, and a bus gate on Downs Road, which also permits buses to pass through.
Following the LTN’s introduction, overall traffic and air quality levels in the Hackney Downs area have improved, with traffic down by 40% inside the low traffic neighbourhood, and air quality improvements at 84 of 118 locations.
The total number of vehicles on boundary roads has not changed significantly, increasing by just 49 vehicles a day, however, as an average of percentages across the roads, an increase of 7% was observed. This demonstrates that relative increases have occurred on specific roads rather than boundary roads as a whole.
Following feedback from local residents about increases in traffic on Northwold Road, the Council will be engaging with residents to develop proposals to mitigate these. This could range from width restriction to restrict heavy goods vehicle access, a major contributor to pollution levels, to a new traffic filter.
The Council is also set to permit Blue Badge holders to drive through part of the low traffic neighbourhood (the Downs Road bus gate) as it has done already for the bus gates at Stoke Newington Church Street and Shepherdess Walk.
During the engagement period, some residents asked that restrictions be added or removed on some roads, such as Benthal Road, Jenner Road, Queensdown Road and Cricketfield Road.
The Council is investigating the issues, and will develop options with local residents, consult on those options and then implement further changes if approved. Monitoring of the traffic flows and air quality in the LTN area will continue throughout this period.
Throughout the trial, the Council encouraged people to respond to its Commonplace page, which was used to identify issues with the LTN and make changes where appropriate.
4,139 responses were received on the Council’s Commonplace page, with local postcodes (N16 and E5) accounting for 75% of responses that provided a postcode. People who use a car or van were overrepresented in the overall results. 66% said they use a motor vehicle to get around, compared to car ownership rates in Hackney Downs LTN of 29.8%.
Overall, 35% of Commonplace responses wanted all or some of the filters to be made permanent, with 64% saying none should be made permanent. In the local area, 41% of respondents from N16 wanted to make all or some of the measures permanent and 37% of respondents from E5 wanted to make all or some of the measures permanent. Among people who do not use a car or van to get around, 64% wanted all or some of the LTN to be made permanent.
For more information, visit hackney.gov.uk/hackney-downs-ltn.
Full traffic and air quality analysis
The tables below compare traffic counts taken in July 2021 and November 2020 with the last available comparable count before the pandemic. Each traffic count is a daily average.
Some counts are listed as not available either because there is no comparable pre-implementation count or because they were out of action or vandalised when monitoring took place.
While there are average % increases on boundary roads, the Council also calculated the total number of vehicles using boundary roads, which has not changed significantly.
Changes in traffic levels inside the LTN, compared to pre-COVID baseline
Changes in traffic levels on boundary roads
Air quality
The Council commissioned an external consultancy, AECOM, to undertake air quality modelling to determine any potential impacts, both positive and negative, that the implementation of the Hackney Downs LTN may have had on air pollutant levels both within the scheme areas and on the boundary roads. The air quality modelling considered changes to the annual mean concentrations of the air pollutants (NO) and particulate matter in the form of PM and PM.
The dispersion modelling uses complex computer software to estimate the levels both with the scheme in place and without, in order to allow comparisons to be made.
The Hackney Downs low traffic neighbourhood is predicted to have decreased nitrogen dioxide concentrations at 84 of the 118 modelled locations, with 34 locations showing an increase. None of these locations were modelled to have nitrogen dioxide concentrations that exceeded national air quality objectives.
I went down to Hackney Downs LTN earlier this week, and it was a joy to see so many people - including school children - walking and cycling in the area.
It’s fantastic that there have been overall reductions in traffic and improvements in air quality in the area, but we know there are a few more things to get right - including on Northwold Road - which is why we’ll be continuing to engage with residents and developing further proposals.
As with all parts of our plans to rebuild a greener Hackney, we’ll be continuing to monitor schemes and listen to feedback.
Cllr Mete Coban MBE, Cabinet Member for Energy, Waste, Transport and Public Realm